
8 April 2020
Big Data & Predictive Analytics – Beyond the Buzzwords
Every business today needs one essential piece of kit: a crystal ball. If you could predict the future, risk and…

Sales & Marketing Insiders
Testimonials, tips and tricks to improve your sales and marketing efficiency
28 February 2017
Last month we wrote an article on “10 helpful tips for improving the click rate”. So we’re not going to do the same thing for opening rates (well, not really!).
Just for once, let’s start with the figures! Because ultimately what interests us most is still to have competitive stats! As is often the case, there are all too few studies on opening rates in B2B. If we look at the most highly regarded study in France on performance figures for email marketing (I have chosen the Experian email barometer) there is a row dedicated to B2B (to which it would be possible to add the row dedicated to Public Contracts):
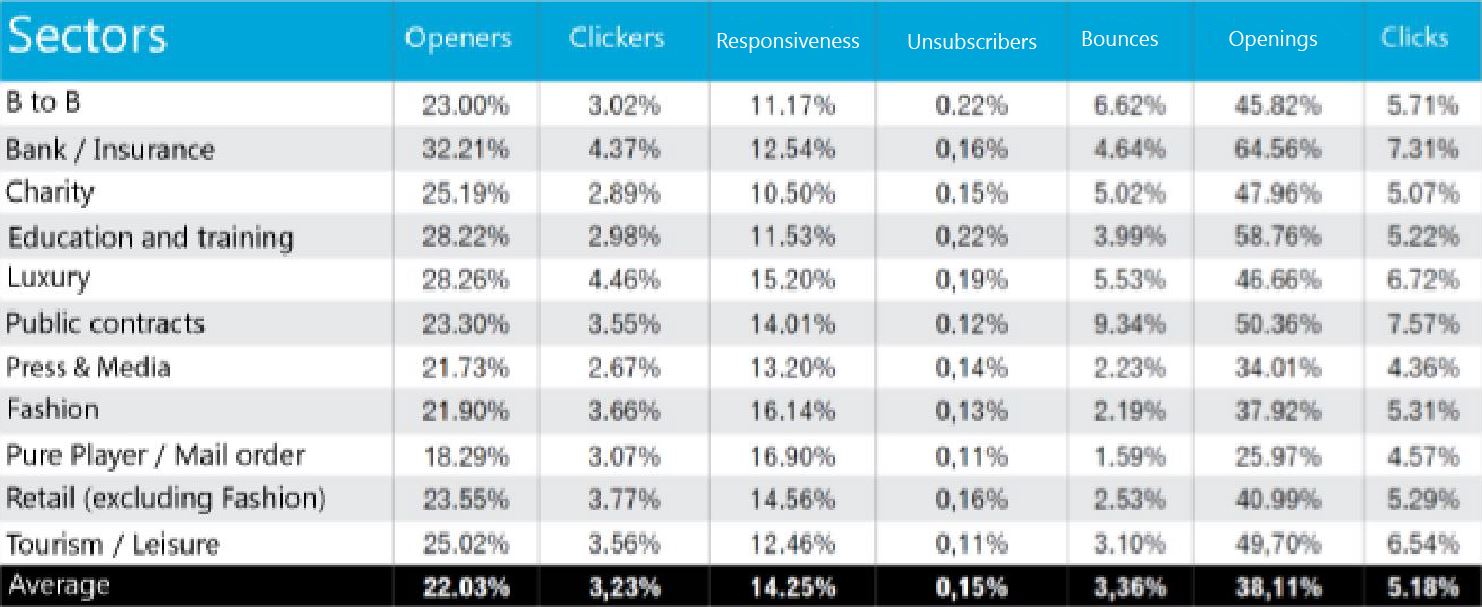
Let us now look at another study, this time provided by Sendgrid (one of the three largest senders of email in the world), which presents global figures. Not unexpectedly, there are relatively few B2B data in the mass of business areas on offer.
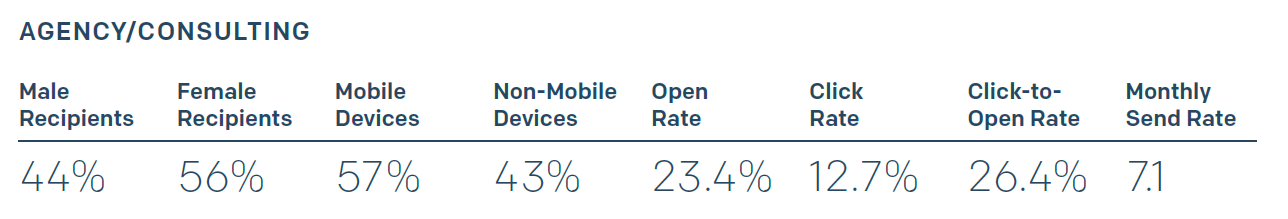
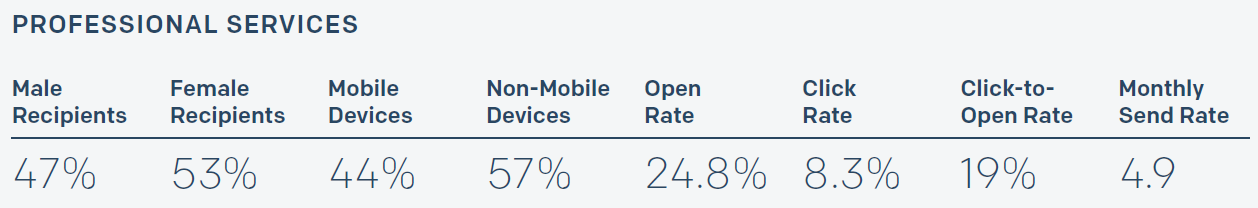
We are therefore only going to dwell on two sectors in the study, on the one hand agencies and consultancy businesses, and on the other services provided to professionals. The first reveals 23.4% of openers, and the second 24.8%. So ultimately this is not far off the results for Experian in France.
Another interesting study is the one by IBM Marketing Cloud which is based on Silverpop customers (bought out by IBM two years ago) and publishes figures for openings in several sectors.
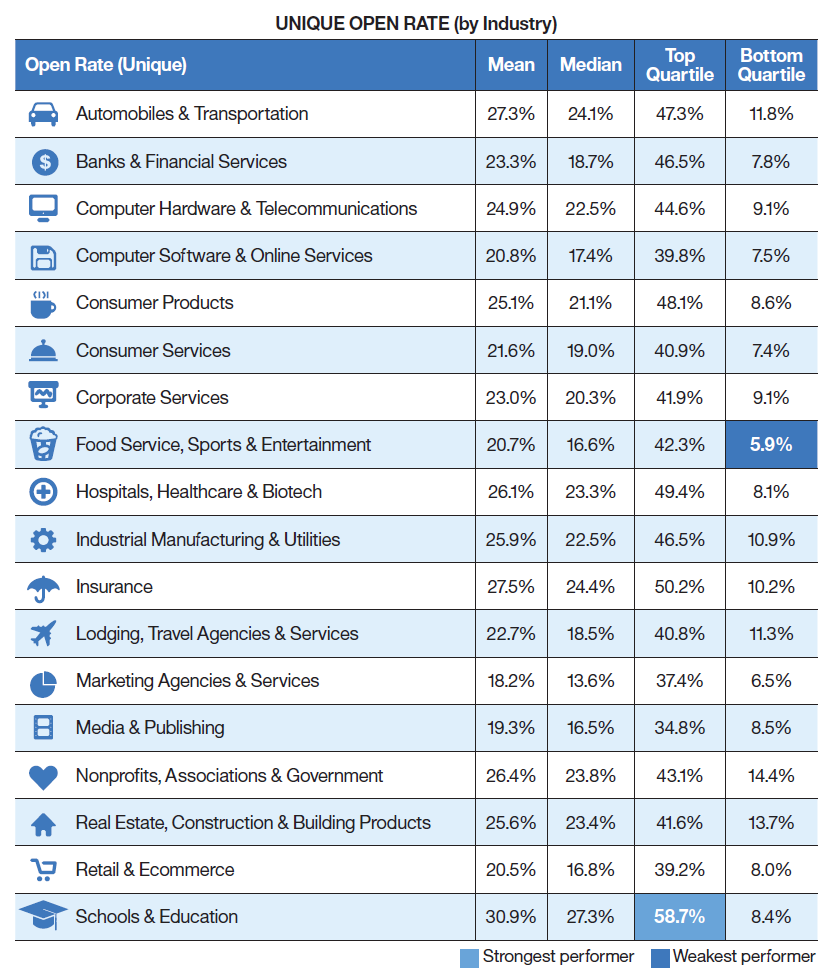
If we look at the average as far as marketing agencies and services are concerned (which ought to be close to the Sendgrid figures), they come out at 18.2%, whereas the Sendgrid rate was 23%. The conclusion could well be that even though everyone loves benchmarks, they should be treated with caution.
It is still possible to say that most of the time the results of B2B campaigns are within a range of 15-25%. We have to remember that the platforms which publish these studies often have customers who use email marketing practices regularly, ie with lower bounce and inactive rates than if you mount a campaign occasionally.
To understand the opening rate, you should really talk about “opening rates”. “Opening rate” can have a lot of different meanings, depending on your platform – here are a few examples to add to the confusion: rate of openers, rate of single openers, opening rates, single opening rates…. and so on. And sometimes you don’t know which one’s which!
But before we go any further, it is important to understand how an opening is measured in technical terms. When an email is sent, if your email system allows this (which is now usually the case), a small transparent image of a pixel on a pixel is added to your email. Every time a recipient displays your email’s images, this image will be called up, and the server will record an opening. So you see what I’m getting at… in email marketing, openings are recorded WHEN IMAGES ARE DISPLAYED! And in the professional world, numerous email clients (Outlook, for instance) do not display images by default…. so we are used to saying that the rate of opening is systematically underestimated.
The router is in general capable of distinguishing between openings by a recipient A from openings by a recipient B. So it is possible to distinguish between several opening rates. And from a terminology point of view, this is important! Out of a target group of 100 people, whether you have 20 people who open once, or ten people who each open twice, makes a great difference. However, in both cases you could say that you have obtained an opening rate of 20%.
An organisation called Email Experience Council has in fact drawn up rules to ensure that everyone is speaking the same language, and using the same rules, but unfortunately, even in router firms, not many people are familiar with these rules and practically no-one uses them. If you want to form an opinion about this, do not hesitate to look at the document called S.A.M.E. Project Guide.
However, this is my take on the terminology and formulae which everyone should use to calculate the different opening rates:
It is noticeable that not all platforms deduct hard bounces when calculating an opening rate, which really does not make sense insofar as a hard bounce has no chance of opening an email.

In an article published in September, Chad White, Research Director at Litmus, explained to us at length why measuring the performance figures for an item in terms of the opening rate may not necessarily be relevant. I’m not going to reiterate his argument here (you would be better off reading his article), but in broad terms he explains that if you want to optimise the item, it is better to compare all the performance figures further down the line, like the click rate or conversion rate – this is particularly true when you are carrying out AB tests.
So what use is the opening rate then, if not to measure the performance figures for an item? Firstly, it does still measure the performance figures of your items a little ;-), but opening an email is triggered above all by the trust which recipients have in the person or company sending it. If you have a real relationship with your recipients (or they have that impression anyway), your opening rates will be better. The opening rate is directly influenced by the degree of commitment of your recipients.
The other key point which you measure with your opening rates is paradoxically the number of emails which arrive in the spam filter or the inbox. The more emails you have in the spam box (these are never considered as bounces and have technically been delivered), the lower your opening rate will be. The best indicator of deliverability is in fact the opening rate by destination (Hotmail, Gmail, Orange etc.), which lets you see instantly where there could be an issue with deliverability.
And that’s all, really! Click rate is king J !
So as not to disappoint you (and to keep a good atmosphere between us), I’m still going to set out a series of tips for good practice intended to help you improve your opening rates. These tips for good practice are mainly directed at the use of the subject line and the names of the sender:
Incidentally, this sort of advice for good email subject lines would probably be a good idea for an article next time!
8 April 2020
Every business today needs one essential piece of kit: a crystal ball. If you could predict the future, risk and…

4 March 2020
By multiplying data sources, predictive marketing can anticipate the requirements of leads and increase the conversion rate. It also rationalises…

26 February 2020
The first goal of a CRM system is to centralise the data concerning clients and leads that will then enable…

4 February 2020
5 Ways in Which Artificial Intelligence is Transforming B2B Marketing
Sparklane puts data at the service of lead generation and sales and marketing efficiency.
©2024 Sparklane

